The notification log
The notification log shows what your notifiers did with each alert: sent, held back or failed. Use it to check that alerts reach you. For setting up a notifier, see Notifications.
What it shows
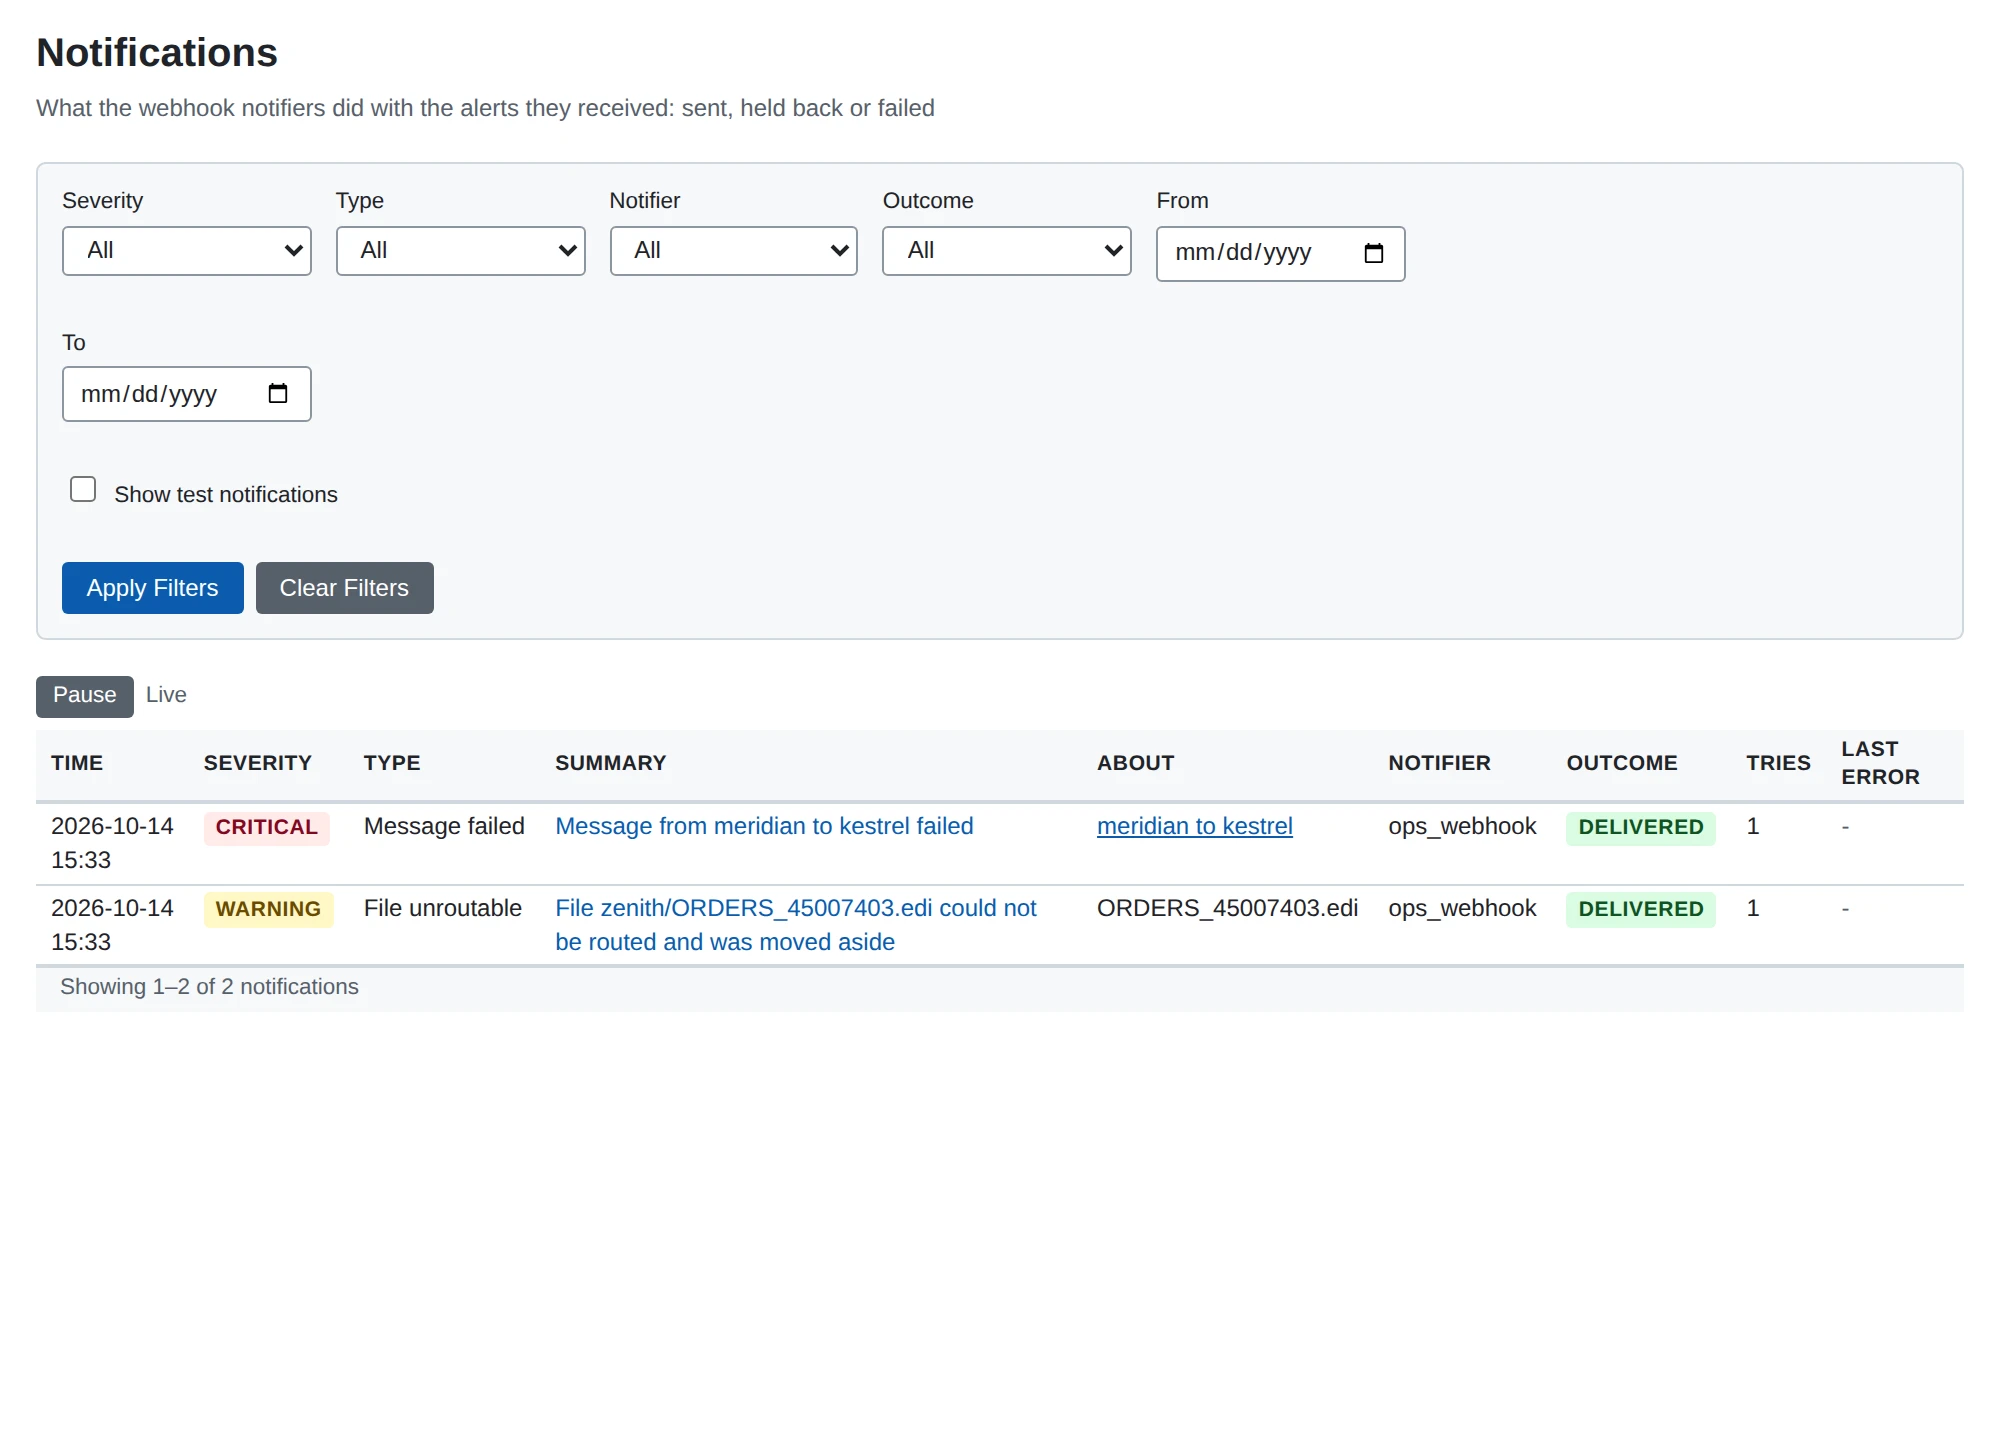
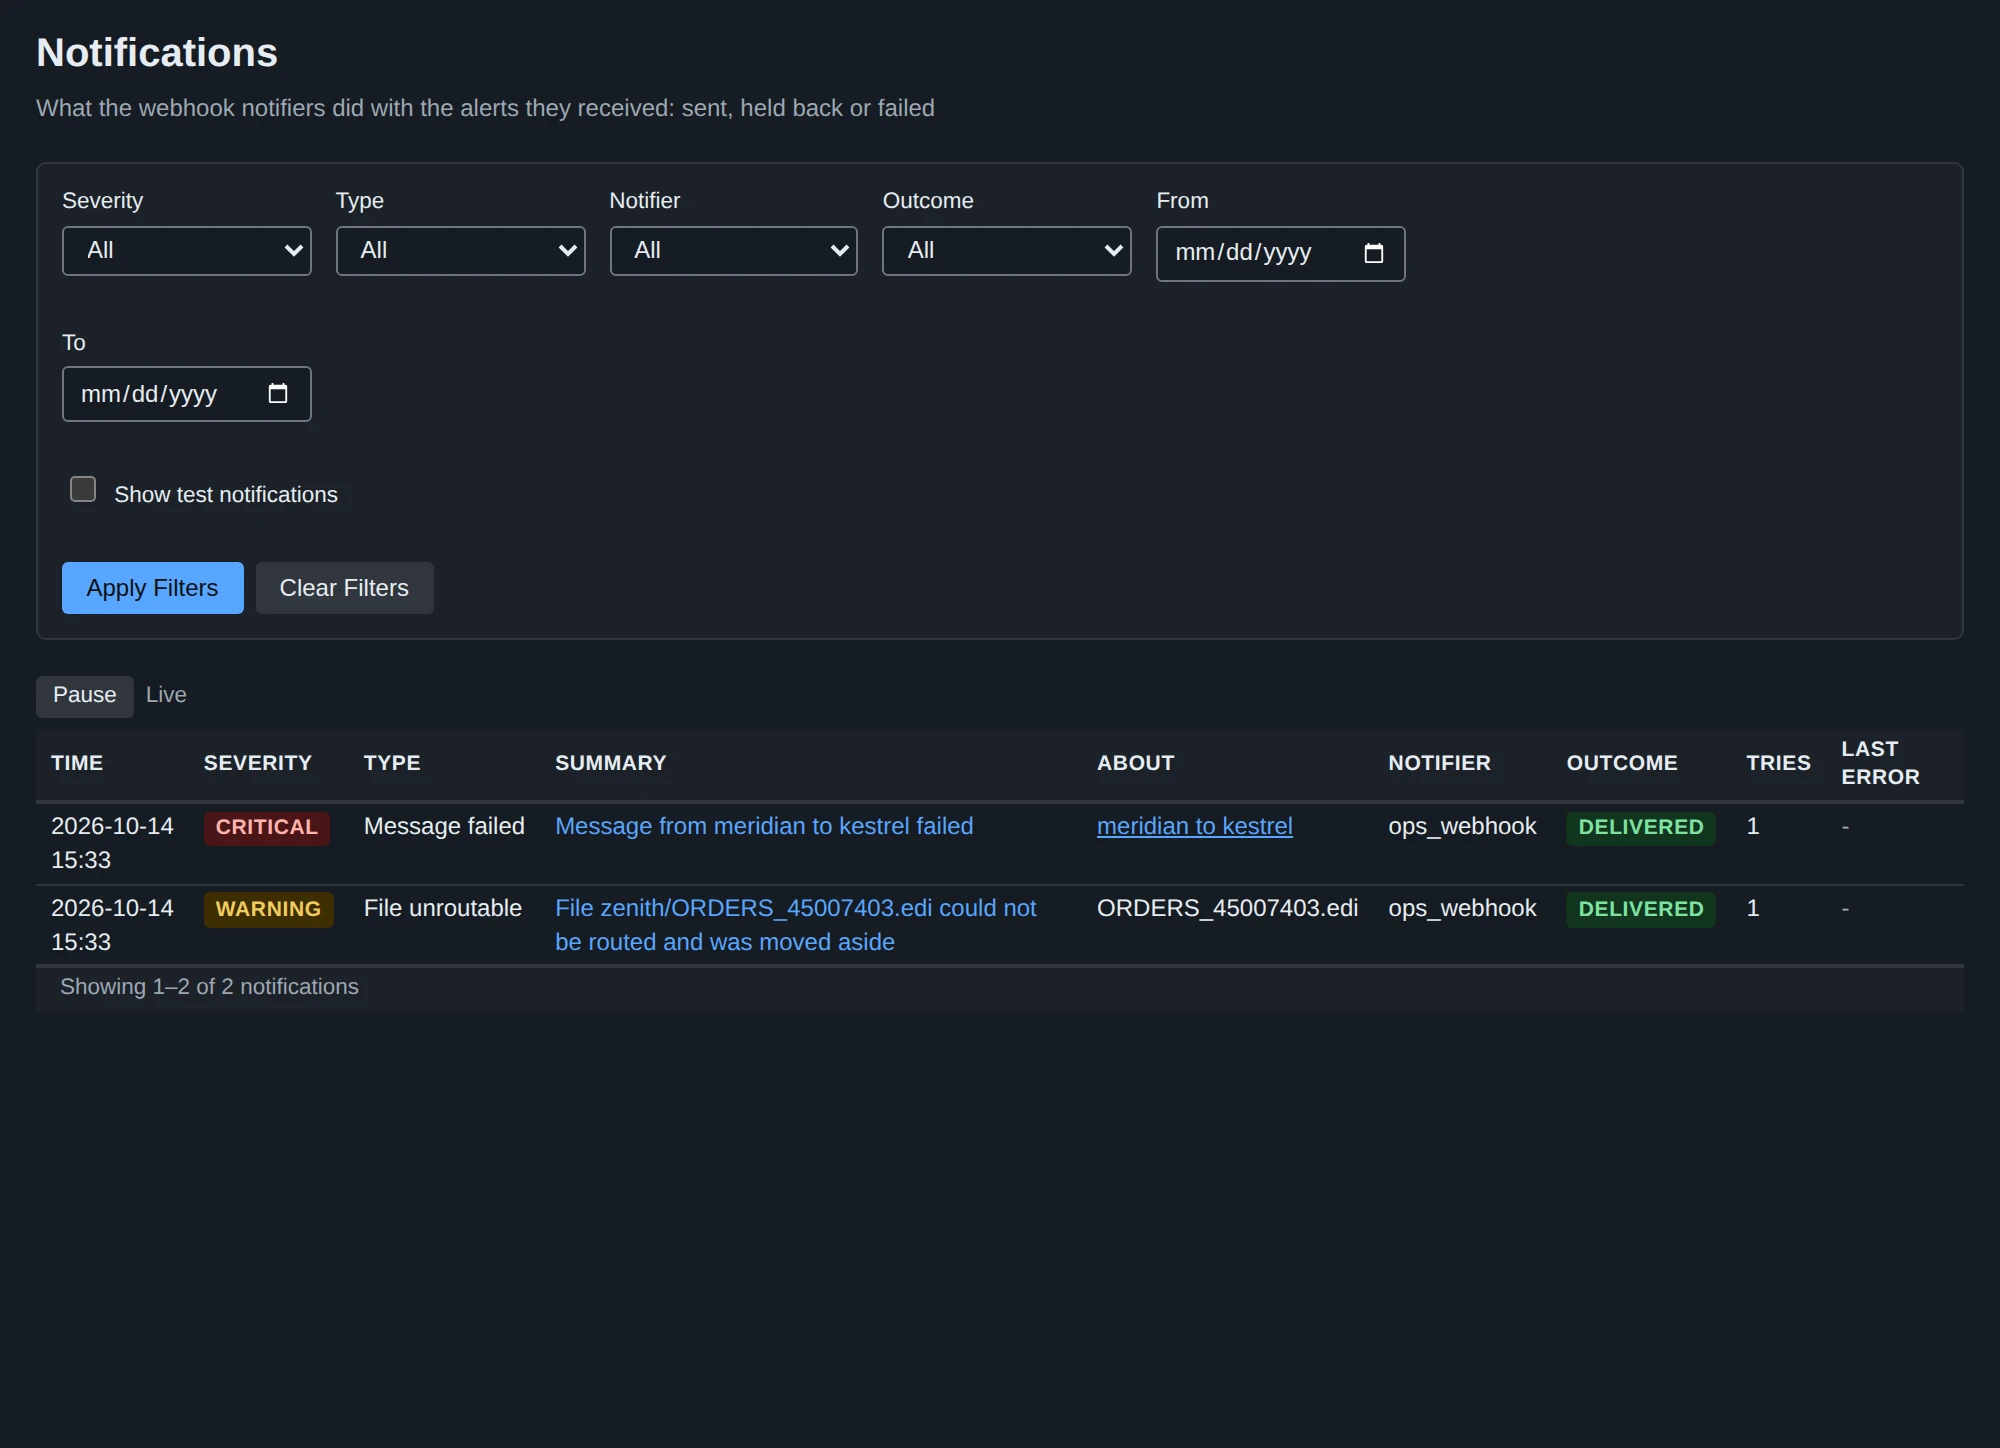
System > Notifications lists every alert a notifier sent or held back, newest first. Each row shows the time, severity, type, summary, what it is about, the notifier, the outcome, the attempts and the last error. Click the summary to see every detail. Click a cut-off error to see all of it.
| Outcome | What it means |
|---|---|
queued | Waiting for its next attempt, or being sent now. |
delivered | The service answered 2xx. |
failed | Given up. The last error says why, for example “the endpoint answered 403 Forbidden” or “no answer within 10s”. |
suppressed_cooldown | Held back by the cooldown. |
grouped | Held back by the rate limit and sent in a summary. |
Alerts that a notifier’s filters drop are not recorded.
You can filter by severity, type, notifier, outcome and date range. Test notifications are hidden unless you tick Show test notifications. The first page updates live. Pause holds updates until you resume.
The log keeps rows for 30 days and at most 10,000 rows. It never holds the webhook URL, a header, the body that was sent or the service’s answer.
For scripts, GET /api/v1/notifications returns the same list with the same filters. See API resources.
The Alerts card
The dashboard has an Alerts card. It shows how many critical alerts the last 24 hours had, and the latest three. An alert that several notifiers sent counts once, and tests do not count. The card only knows alerts a notifier received. Without a notifier it shows 0.